Note: HIC-HLRN republishes this article from Citiscope as a report from the ““Fulfilling Habitat Commitments: Assessing the Past - Constructing a Platform for Action,” Surabaya, 24 July 2016. However, this does not suggest that HIC or HLRN endorse the methodology or the findings of the HCI exercise, as the criteria measured were driven by available data selected from World Bank and other sources, not necessarily related to commitments of the Habitat Agenda. A systematic evaluation of implementing Habitat II commitments has never taken place. For HIC-HLRN’s note on Habitat II evaluation methodology, see A Tool for Evaluative Habitat III Reporting: Responding to the Need for Evaluative National Reports.
Countries made only marginal progress on urban commitments since 1996, index finds. Even as governments are negotiating a New Urban Agenda, the Habitat III process has no formal way to check in on progress made since Habitat II.
SURABAYA, Indonesia—“In God we trust; all others bring data.” The famous dictum of former New York City mayor Michael Bloomberg has become de rigueur in many city governments. But the sentiment is slower to percolate up in the international arena, especially on the issue of urban development.
Last year, a group of scholars at the Global Urban Futures research unit of the New School in New York City noticed a dearth of data on a timely issue: whether governments have met their commitments under the Habitat Agenda, a 1996 international agreement on human settlements — everything from mega-cities to small villages — that came out of the United Nations’ Habitat II conference in Istanbul.
The question is a timely one because in October, the U. N.’s member states will once again convene on this topic under the auspices of the Habitat III conference in Quito, Ecuador. The hope is that countries will agree on a fresh 20-year strategy for urbanization called the New Urban Agenda. But before adopting a whole new set of commitments, the Global Urban Futures researchers undertook a quantitative and qualitative study to see just how well national governments have kept their last set of promises.
[See: Fractured continuity: Moving from Habitat II to Habitat III]
The results, called the Habitat Commitment Index (HCI), were launched here on the eve of key talks that organizers hope will finalize the New Urban Agenda well ahead of the Quito summit. The new analysis gives reason for pause, however, suggesting that the world inched only marginally closer to meeting its Habitat-related commitments over the past 20 years. Such conclusions serve as both a baseline and a warning for the impending adoption of the New Urban Agenda.
How it works
The HCI researchers scanned the Habitat Agenda’s 109 pages, distilling its prose down to seven broad commitments: adequate shelter for all, sustainable human settlements, enablement and participation, financing shelter and human settlements, gender equality and international cooperation.
“Institutional development is one of the most fragile things in all of this. If your institutional capacity doesn’t keep up with your economic growth, you’re going to have trouble delivering.”
—Michael Cohen
The New School
The team then sought existing data sets that could translate these principles into numbers. This is no easy task, it turns out, especially when the point of the exercise is to measure the fulfillment of such aspirations at the city level. By just one example, the researchers discovered that in the past 20 years, no European country has collected poverty data at the urban level.
[See: Ahead of New Urban Agenda draft, national reports offer country-specific lens]
After combing through over 100 data sets, the research team settled on 15 that met a crucial criterion: They positively correlate with gross domestic product. That is to say, countries would be judged against the potential of their economic situation, not in absolute terms.
For example, while 37 percent of Burundians living in cities had access to electricity in 1996, more than 96 percent of Belizeans did. These numbers would suggest that the latter was performing much better than the former, at least on this metric. However, when controlled for the fact that Belize’s GDP was 10 times that of Burundi’s, it turns out both countries were doing more or less equally given their resource constraints.
Drawn mostly from World Bank data, the chosen indicators cover some urban-specific areas, such as piped water on premises and access to electricity. Others lack geographic specificity, like female tertiary school enrollment and infant mortality. While the HCI researchers acknowledge that these indicators are far from perfect, their effort is in part to show the need for better data collection in the future.
Marginal global progress
When the ink dried on the Habitat Agenda in 1996, the world was already meeting about 70 percent of its commitments, resulting in an average global score of 69.68 on the HCI. Flash forward 20 years, and the global score has ticked up only slightly to 71.17.
“UN-Habitat has not prepared any appraisal of how its member states have lived up — or not — to the grandiose statements agreed upon in Istanbul at the Habitat II conference.”
Of course, a lot has happened in the past two decades to disrupt countries’ progress toward goals on issues such as providing shelter and strengthening local government. Asia suffered a financial crisis in 1999, while the whole world underwent a major financial crisis in 2008. The Middle East saw U. S.-led wars in Iraq and Afghanistan, the Arab Spring and the ongoing crisis in Syria alongside the rise of the Islamic State. Europe, too, has dealt with a series of sagging economies and a recent influx of migrants and refugees. Major natural disasters have affected countries and entire regions, in addition to the broader growing impacts of climate change.
[See: Eight key trends that define two decades of global urbanization]
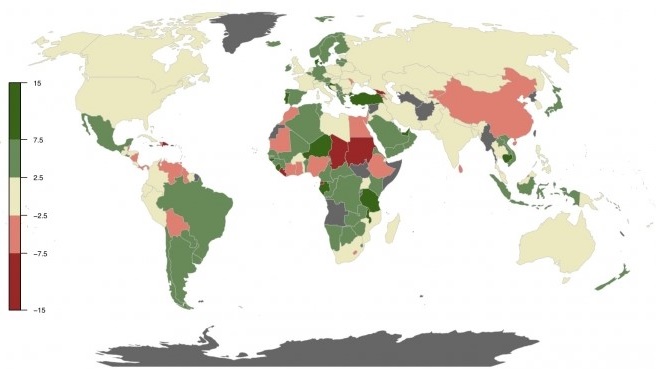
Nevertheless, the study’s lead author, New School professor Michael Cohen, said he found the findings surprising. “There are a large number of countries who do not improve at all, despite economic growth,” he said. See below for a map from the index showing progress or otherwise on a country-by-country basis:
China is the most obvious case study, given both its rapid urbanization and economic rise in the past two decades. Its current GDP per capita is more than four times greater than it was in 1996, and its urban population increased by 96 percent. Meanwhile, its HCI score dropped from 5.6 points on the index.
[See: Between Habitat II and III, China changed everything]
India, the other major population powerhouse, also dropped slightly — although by less than one index point — in the past 20 years. Cohen hypothesized that this could be due to “the relationship between the size of demand for services and the ability to respond.”
Another disappointment came from Colombia, home to cities such as Bogotá and Medellín that are much ballyhooed for their urban innovation. It dropped just over one point on the index. Indeed, Latin America is home to the worst performer, according to the index — the Dominican Republic, which saw a massive drop in women’s enrollment in higher education and participation in the labour force. Its HCI index score of 54 was the lowest globally.
The researchers concluded that a steep decline in the strength and effectiveness of government institutions was the biggest drag on the global HCI score, enough to offset gains made on gender equality, poverty, infrastructure and sustainability.
“Institutional development is one of the most fragile things in all of this,” Cohen said. “If your institutional capacity doesn’t keep up with your economic growth, you’re going to have trouble delivering.”
[See: The United Nations risks stifling its own progress on sustainable urbanization]
Despite the overall poor performance, there were bright spots that defied the global narrative of runaway urbanization in the developing world. “Countries could have really explosive growth in urban population and still manage to do quite well in service delivery,” said HCI researcher Bart Orr.
Cambodia’s urban population skyrocketed by 69 percent from 1996 to 2014, for example, yet the country climbed nearly 8.6 points on the HCI index. That made it the strongest performer among East and South Asian countries, and one of the best globally. For HCI researcher Lena Simet, that observation shows that “increase in urban population alone does not always tell you the entire story.”
The 1996 Habitat Agenda also was hailed for its progressive language on gender equity, coming just a year after the landmark U. N. Commission on the Status of Women. Gender advocates can take solace that the world did best in this category, with an average increase in gender equity of 8.62 points on the HCI scale, resulting in a global average of 76.82. The improvements largely came about because of an increase in female tertiary school enrollment.
[See: Can the New Urban Agenda fundamentally transform gender relations?]
‘Collective amnesia’
Government representatives and civil society groups have had little time to digest the new findings. Nonetheless, South Africa’s lead negotiator on the Habitat III process, Monika Glinzler, did offer an immediate reaction to her country’s uptick of less than 0.5 points. “I felt very deflated,” she said. “We believe the mandate of 1996 is still valid because of unfinished business.”
“Once again, the ink will dry on a document — this time, the New Urban Agenda — but civil society groups hope there will be a more-concerted effort to track progress this time.”
Ultimately, the HCI seeks to fill a void left by the U. N. system — notably UN-Habitat, the agency that takes its mandate from the Habitat Agenda. Indeed, the Nairobi-based office has not prepared any appraisal of how its member states have lived up—or not—to the grandiose statements agreed upon in Istanbul at the Habitat II conference.
[See: Will the New Urban Agenda define the future of UN-Habitat?]
Consequently, the HCI findings were delivered at a crucial moment, on the eve of what are currently the last round of formal negotiations before the two-year Habitat III process wraps up in Quito. Once again, the ink will dry on a document — this time, the New Urban Agenda — but civil society groups hope there will be a more-concerted effort to track progress this time.
Joseph Schechla of the Habitat International Coalition, a watchdog group that advocates for the implementation of the Habitat Agenda, expressed disappointment in how implementation of the 1996 document played out. “There was a spectacular failure of UN-Habitat to do its operation on monitoring,” he said. In the run-up to Habitat III, he said, the current conference’s predecessor has been given short shrift: “We are invited by UN-Habitat leadership to join in collective amnesia.”
[See: Shouldn’t the New Urban Agenda be a binding agreement?]
Indeed, the role of UN-Habitat in monitoring progress on the new document has been a main point of contention in the past few months of negotiations that took place at U. N. Headquarters in New York. While African countries have pushed hard for the agency to be strengthened, both because of its geographic location in Nairobi and extensive technical assistance programmes serving African governments, the European Union and the United States have resisted giving UN-Habitat the sole, or even lead, role in tracking the New Urban Agenda.
Even as its future role in the implementation of the New Urban Agenda remains up for debate, UN-Habitat has been pressing ahead with a variety of tools to track progress for the next 20 years under the leadership of the agency’s executive director, Joan Clos, himself a data-driven former mayor (and also secretary-general of Habitat III).
[See: How will we know if the New Urban Agenda has been successful?]
On the opening day of the Surabaya talks, the agency has already showcased the impending release of the data-heavy Habitat III regional reports, prepared by the U. N.’s five regional commissions. It also has been highlighting its own index for measuring sustainable urban development, the City Prosperity Initiative, as well as satellite land-cover measurement of urban growth, the U. N. Sample of Cities.
Summing up these efforts, Clos said, “To develop a real science about urbanization, we need to have hard data.”
Graphic: Map of globe indicating the HCI rating of countries.